Red Wattlebird
Anthochaera carunculata
ABR description
The following is extracted from the Annual Bird Report for the twelve months to June 2017.
Very common, breeding resident/ autumn migrant
The most commonly reported honeyeater with records throughout the year and across the region.
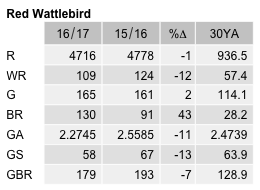
General: Number of records almost identical to last year, but reporting rate of 34% was below the 41% last year and much closer to the 34.4% 30YA. The number of birds was lower than last year’s significant peak, but still more than 5 times the 30YA, continuing the dramatic increase of the last 3 years. This appears to be due to increased observer effort and large groups (20+) being regularly reported from several locations around Canberra. Records fairly even throughout seasons with a slight peak in spring (28%). Max 123/23 April JWNR (MiP1), mean 3.5, median 2. 130 breeding records, the highest number ever, and 39 more than last year: the first relatively late for this species, nb/29 Aug JWNR (LeM1), last dy/26 Feb Wamboin (McD1).
GBS: Recorded at all but one site in all weeks, with observations distributed evenly throughout the four seasons. Abundance (A = 2.2745) has declined slightly over the last two years, and has now dipped below the 30YA. Like last year, the Red Wattlebird is the most abundant honeyeater species in the GBS. Breeding records slightly fewer than last year, recorded at 32 of 59 sites: first nb/5wk Jul Florey (BrJ3), last dy/1wk Mar Chapman (HoJ1),
Abundance
Abundance is the average number of birds of that species per survey. Where the species was observed (presence recorded) but the number of birds seen was not recorded, this is treated as a count of zero.
Abundance by year
This chart shows the abundance of Red Wattlebird between 1982 and 2017. 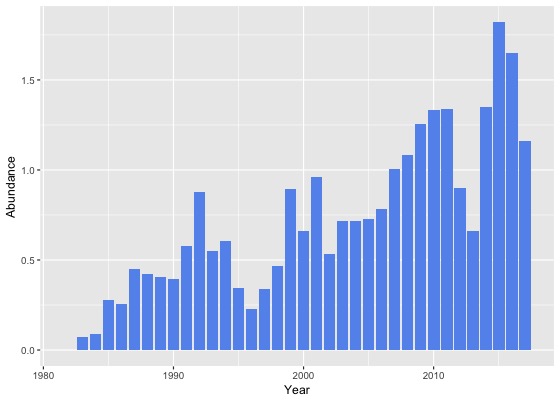
Abundance by month
This chart shows the monthly abundance of Red Wattlebird. The blue lines show the abundance for the twelve months to June 2017 and the bars show the average abundance for the period 1982 to 2017. 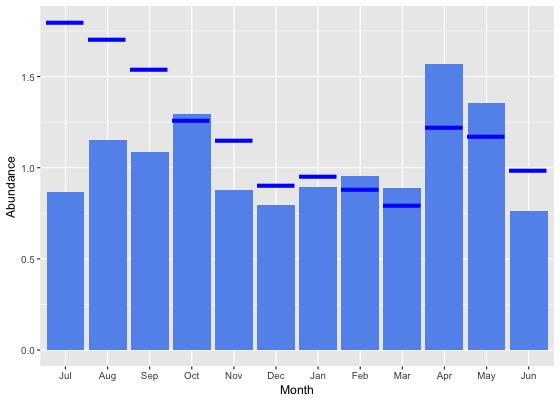
Abundance by season
This chart shows the seasonal abundance of Red Wattlebird. The blue lines show the seasonal abundance for the twelve months to June 2017 and the bars show the average seasonal abundance for the period 1982 to 2017. 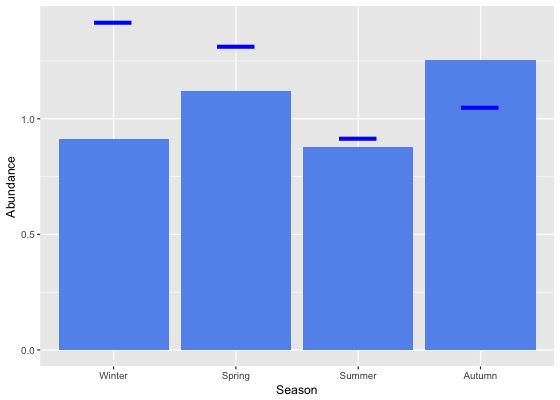
Abundance data
| Month | Season | ||||||||||||||||||
|---|---|---|---|---|---|---|---|---|---|---|---|---|---|---|---|---|---|---|---|
| Period | Jul | Aug | Sep | Oct | Nov | Dec | Jan | Feb | Mar | Apr | May | Jun | Winter | Spring | Summer | Autumn | All | ||
| All years | |||||||||||||||||||
| All | 0.9 | 1.2 | 1.1 | 1.3 | 0.9 | 0.8 | 0.9 | 1.0 | 0.9 | 1.6 | 1.4 | 0.8 | 0.9 | 1.1 | 0.9 | 1.3 | 1.0 | ||
| Previous years | |||||||||||||||||||
| All previous years | 0.7 | 1.0 | 1.0 | 1.3 | 0.8 | 0.8 | 0.9 | 1.0 | 0.9 | 1.6 | 1.4 | 0.7 | 0.8 | 1.1 | 0.9 | 1.3 | 1.0 | ||
| Previous 30 years | 0.7 | 1.1 | 1.0 | 1.3 | 0.8 | 0.8 | 0.9 | 1.0 | 0.9 | 1.6 | 1.4 | 0.7 | 0.8 | 1.1 | 0.9 | 1.3 | 1.0 | ||
| Previous 20 years | 0.9 | 1.3 | 1.2 | 1.5 | 1.0 | 0.8 | 1.0 | 1.1 | 1.0 | 1.8 | 1.7 | 0.8 | 1.0 | 1.2 | 1.0 | 1.5 | 1.2 | ||
| 10 year groups | |||||||||||||||||||
| [2007,2017) | 1.2 | 1.6 | 1.3 | 1.6 | 1.2 | 1.1 | 1.0 | 1.3 | 1.2 | 1.9 | 1.9 | 1.0 | 1.2 | 1.4 | 1.1 | 1.6 | 1.4 | ||
| [1997,2007) | 0.3 | 0.6 | 0.9 | 0.9 | 0.5 | 0.4 | 0.6 | 0.6 | 0.7 | 1.5 | 1.2 | 0.4 | 0.5 | 0.8 | 0.5 | 1.1 | 0.7 | ||
| [1987,1997) | 0.3 | 0.3 | 0.4 | 0.5 | 0.4 | 0.5 | 0.5 | 0.4 | 0.4 | 0.9 | 0.4 | 0.2 | 0.3 | 0.5 | 0.5 | 0.6 | 0.5 | ||
| 5 year groups | |||||||||||||||||||
| [2012,2017) | 1.2 | 1.7 | 1.4 | 1.6 | 1.3 | 1.2 | 1.0 | 1.4 | 1.3 | 2.0 | 2.0 | 1.1 | 1.3 | 1.4 | 1.2 | 1.7 | 1.4 | ||
| [2007,2012) | 1.2 | 1.2 | 1.0 | 1.7 | 1.0 | 0.8 | 1.2 | 0.9 | 0.7 | 1.7 | 1.7 | 0.7 | 1.0 | 1.4 | 1.0 | 1.4 | 1.2 | ||
| [2002,2007) | 0.4 | 0.7 | 0.6 | 0.9 | 0.5 | 0.4 | 0.6 | 0.8 | 0.6 | 1.6 | 1.2 | 0.4 | 0.5 | 0.7 | 0.5 | 1.1 | 0.7 | ||
| [1997,2002) | 0.2 | 0.6 | 1.2 | 0.8 | 0.5 | 0.5 | 0.7 | 0.5 | 0.7 | 1.3 | 1.1 | 0.5 | 0.5 | 0.9 | 0.5 | 1.0 | 0.7 | ||
| [1992,1997) | 0.2 | 0.4 | 0.3 | 0.6 | 0.4 | 0.6 | 0.5 | 0.2 | 0.5 | 1.5 | 0.4 | 0.1 | 0.3 | 0.4 | 0.5 | 0.8 | 0.5 | ||
| [1987,1992) | 0.3 | 0.3 | 0.5 | 0.5 | 0.5 | 0.5 | 0.5 | 0.4 | 0.4 | 0.6 | 0.4 | 0.3 | 0.3 | 0.5 | 0.5 | 0.5 | 0.4 | ||
| Year | |||||||||||||||||||
| 2017 | 1.8 | 1.7 | 1.5 | 1.3 | 1.2 | 0.9 | 1.0 | 0.9 | 0.8 | 1.2 | 1.2 | 1.0 | 1.4 | 1.3 | 0.9 | 1.1 | 1.2 | ||
| 2016 | 1.4 | 1.9 | 1.6 | 1.4 | 1.6 | 1.4 | 1.3 | 1.4 | 1.5 | 2.3 | 2.4 | 1.8 | 1.7 | 1.5 | 1.3 | 2.0 | 1.7 | ||
| 2015 | 1.6 | 2.5 | 2.2 | 2.1 | 1.2 | 1.5 | 1.3 | 2.5 | 1.7 | 2.5 | 1.9 | 1.1 | 1.6 | 1.9 | 1.7 | 2.0 | 1.8 | ||
| 2014 | 1.3 | 1.8 | 1.1 | 1.8 | 1.2 | 1.2 | 0.9 | 0.9 | 1.4 | 1.5 | 2.1 | 1.4 | 1.5 | 1.5 | 0.9 | 1.6 | 1.4 | ||
| 2013 | 0.5 | 0.7 | 0.5 | 1.1 | 0.8 | 0.4 | 0.5 | 0.3 | 0.6 | 1.0 | 1.2 | 0.4 | 0.5 | 0.8 | 0.4 | 0.8 | 0.7 | ||
| 2012 | 0.4 | 0.6 | 0.7 | 1.3 | 1.2 | 1.1 | 0.8 | 0.7 | 0.9 | 1.4 | 0.6 | 0.3 | 0.4 | 1.1 | 0.9 | 1.1 | 0.9 | ||
| 2011 | 3.4 | 2.9 | 1.9 | 2.1 | 1.2 | 0.7 | 1.3 | 1.2 | 0.4 | 1.3 | 1.0 | 0.5 | 1.6 | 1.9 | 1.0 | 0.9 | 1.3 | ||
| 2010 | 0.8 | 0.7 | 0.7 | 1.4 | 0.8 | 0.6 | 0.9 | 1.1 | 1.4 | 2.9 | 3.3 | 1.6 | 1.2 | 1.1 | 0.8 | 2.3 | 1.3 | ||
| 2009 | 1.1 | 1.3 | 1.5 | 2.2 | 1.1 | 1.1 | 1.4 | 0.7 | 0.4 | 1.4 | 0.6 | 0.2 | 0.7 | 1.8 | 1.1 | 0.9 | 1.3 | ||
| 2008 | 0.3 | 0.5 | 0.7 | 1.2 | 0.5 | 0.6 | 1.0 | 0.6 | 0.7 | 1.7 | 3.8 | 1.2 | 0.8 | 1.0 | 0.7 | 1.8 | 1.1 | ||
| 2007 | 0.2 | 0.5 | 0.4 | 1.7 | 1.1 | 1.2 | 1.2 | 0.6 | 0.5 | 1.6 | 1.4 | 0.4 | 0.4 | 1.2 | 1.1 | 1.1 | 1.0 | ||
| 2006 | 0.4 | 0.7 | 0.6 | 1.5 | 0.5 | 0.4 | 0.8 | 0.4 | 0.6 | 1.5 | 0.9 | 0.5 | 0.5 | 1.0 | 0.6 | 0.9 | 0.8 | ||
| 2005 | 0.5 | 0.6 | 0.4 | 0.6 | 0.8 | 0.6 | 0.8 | 0.8 | 0.6 | 0.7 | 1.8 | 0.5 | 0.5 | 0.6 | 0.7 | 1.1 | 0.7 | ||
| 2004 | 0.4 | 0.4 | 0.6 | 0.5 | 0.5 | 0.3 | 0.6 | 0.5 | 0.8 | 2.5 | 1.8 | 0.3 | 0.4 | 0.5 | 0.5 | 1.6 | 0.7 | ||
| 2003 | 0.2 | 0.7 | 0.9 | 0.5 | 0.5 | 0.3 | 0.3 | 1.6 | 0.5 | 1.9 | 0.6 | 0.2 | 0.4 | 0.7 | 0.7 | 1.0 | 0.7 | ||
| 2002 | 0.5 | 0.9 | 0.6 | 0.7 | 0.4 | 0.4 | 0.3 | 0.3 | 0.6 | 1.1 | 0.5 | 0.2 | 0.5 | 0.6 | 0.4 | 0.8 | 0.5 | ||
| 2001 | 0.2 | 0.7 | 2.4 | 0.8 | 0.5 | 0.5 | 0.7 | 0.4 | 0.6 | 2.7 | 0.8 | 0.6 | 0.4 | 1.5 | 0.5 | 1.3 | 1.0 | ||
| 2000 | 0.3 | 0.8 | 0.9 | 0.7 | 0.8 | 0.5 | 0.7 | 0.6 | 0.4 | 1.0 | 0.6 | 0.4 | 0.5 | 0.8 | 0.6 | 0.7 | 0.7 | ||
| 1999 | 0.2 | 0.7 | 0.4 | 0.7 | 0.7 | 0.6 | 0.8 | 0.6 | 1.4 | 0.9 | 2.0 | 0.9 | 0.8 | 0.6 | 0.7 | 1.4 | 0.9 | ||
| 1998 | 0.1 | 0.5 | 0.7 | 1.8 | 0.1 | 0.2 | 0.6 | 0.2 | 0.3 | 0.0 | 0.5 | 0.1 | 0.2 | 0.8 | 0.3 | 0.3 | 0.5 | ||
| 1997 | 0.4 | 0.1 | 0.2 | 0.2 | 0.1 | 0.2 | 0.8 | 0.2 | 1.7 | 0.7 | 0.4 | 0.0 | 0.2 | 0.2 | 0.3 | 0.8 | 0.3 | ||
| 1996 | 0.1 | 0.2 | 0.0 | 0.4 | 0.3 | 0.3 | 0.3 | 0.1 | 0.1 | 0.6 | 0.2 | 0.1 | 0.1 | 0.3 | 0.2 | 0.2 | 0.2 | ||
| 1995 | 0.3 | 0.1 | 0.1 | 0.4 | 0.4 | 0.1 | 0.4 | 0.2 | 0.2 | 1.3 | 0.3 | 0.1 | 0.2 | 0.3 | 0.3 | 0.7 | 0.3 | ||
| 1994 | 0.3 | 0.7 | 0.2 | 0.7 | 0.1 | 2.0 | 0.9 | 0.2 | 0.5 | 1.3 | 0.6 | 0.1 | 0.4 | 0.3 | 0.9 | 0.9 | 0.6 | ||
| 1993 | 0.1 | 1.1 | 0.3 | 0.8 | 0.7 | 0.4 | 1.0 | 0.3 | 0.7 | 0.4 | 0.3 | 0.2 | 0.5 | 0.6 | 0.6 | 0.5 | 0.6 | ||
| 1992 | 0.2 | 0.1 | 0.8 | 1.0 | 0.5 | 0.8 | 0.2 | 0.3 | 1.1 | 4.6 | 0.8 | 0.1 | 0.1 | 0.8 | 0.5 | 2.0 | 0.9 | ||
| 1991 | 0.5 | 0.1 | 0.9 | 0.4 | 1.0 | 0.5 | 0.8 | 0.7 | 0.3 | 1.0 | 0.5 | 0.4 | 0.4 | 0.8 | 0.6 | 0.6 | 0.6 | ||
| 1990 | 0.1 | 0.2 | 0.3 | 0.2 | 0.3 | 0.3 | 0.4 | 0.3 | 0.4 | 1.2 | 1.1 | 0.8 | 0.3 | 0.3 | 0.3 | 0.9 | 0.4 | ||
| 1989 | 0.2 | 0.4 | 0.5 | 0.5 | 0.4 | 0.5 | 0.5 | 0.4 | 0.4 | 0.4 | 0.3 | 0.2 | 0.3 | 0.5 | 0.5 | 0.4 | 0.4 | ||
| 1988 | 0.3 | 0.4 | 0.5 | 0.5 | 0.4 | 0.5 | 0.5 | 0.4 | 0.5 | 0.5 | 0.3 | 0.3 | 0.3 | 0.5 | 0.5 | 0.4 | 0.4 | ||
| 1987 | 0.3 | 0.3 | 0.5 | 0.5 | 0.5 | 0.5 | 0.5 | 0.4 | 0.4 | 0.5 | 0.4 | 0.3 | 0.3 | 0.5 | 0.5 | 0.5 | 0.5 | ||
| 1986 | 0.1 | 0.4 | 0.2 | 0.7 | 0.2 | 0.1 | 0.1 | 0.2 | 0.1 | 0.4 | 0.2 | 0.1 | 0.2 | 0.4 | 0.2 | 0.3 | 0.3 | ||
| 1985 | 0.2 | 0.7 | 0.1 | 0.2 | 0.2 | 0.2 | 0.2 | 1.6 | 0.1 | 0.2 | 0.1 | 0.1 | 0.3 | 0.2 | 0.5 | 0.1 | 0.3 | ||
| 1984 | 0.0 | 0.0 | 0.0 | 0.0 | 0.0 | 0.0 | 0.0 | 0.2 | 0.1 | 0.1 | 0.2 | 0.1 | 0.1 | 0.0 | 0.1 | 0.1 | 0.1 | ||
| 1983 | 0.0 | 0.0 | 0.0 | 0.2 | 0.3 | 0.1 | 0.0 | 0.1 | 0.0 | - | 0.0 | 0.0 | 0.0 | 0.2 | 0.1 | 0.0 | 0.1 | ||
| 1982 | - | 0.0 | - | 0.0 | 0.0 | 0.0 | - | 0.0 | - | 0.0 | - | 0.0 | 0.0 | 0.0 | 0.0 | 0.0 | 0.0 | ||
Reporting rates
Reporting rate is the proportion of all surveys in which the species was present.
Reporting rate by year
This chart shows the reporting rate of Red Wattlebird each year between 1982 and 2017. 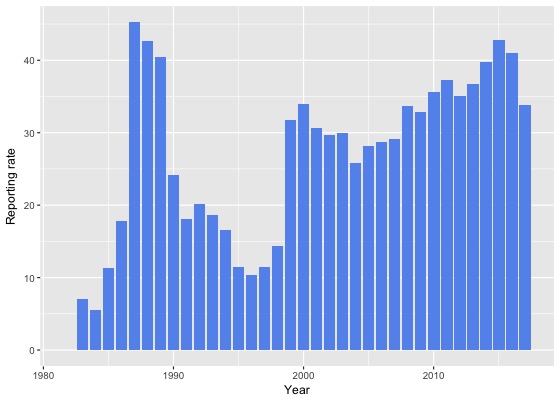
Reporting rate by month
This chart shows the reporting rate by month of Red Wattlebird. The blue lines show the reporting rate for the twelve months to June 2017 and the bars show the average reporting rate for the period 1982 to 2017. 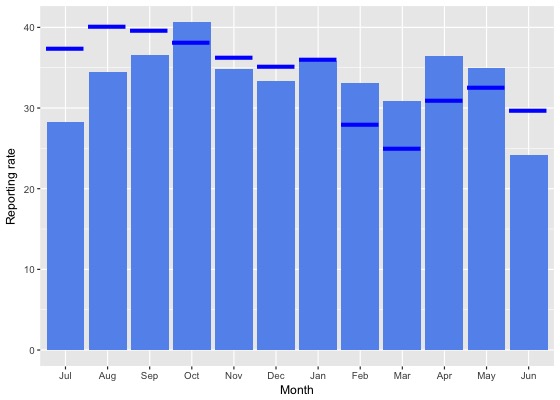
Reporting rate by season
This chart shows the seasonal reporting rate of Red Wattlebird. The blue lines show the seasonal reporting rate for the twelve months to June 2017 and the bars show the average seasonal reporting rate for the period 1982 to 2017. 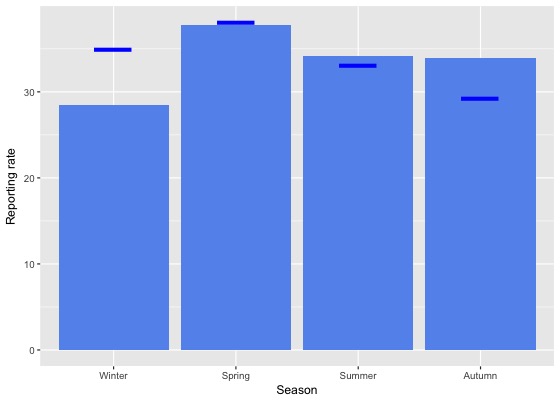
Reporting rate data
| Month | Season | ||||||||||||||||||
|---|---|---|---|---|---|---|---|---|---|---|---|---|---|---|---|---|---|---|---|
| Period | Jul | Aug | Sep | Oct | Nov | Dec | Jan | Feb | Mar | Apr | May | Jun | Winter | Spring | Summer | Autumn | All | ||
| All years | |||||||||||||||||||
| All | 28.2 | 34.5 | 36.6 | 40.6 | 34.8 | 33.3 | 35.8 | 33.0 | 30.8 | 36.5 | 34.9 | 24.1 | 28.4 | 37.8 | 34.1 | 33.9 | 34.0 | ||
| Previous years | |||||||||||||||||||
| All previous years | 26.8 | 33.4 | 36.2 | 40.9 | 34.5 | 33.0 | 35.8 | 34.1 | 31.8 | 37.4 | 35.5 | 23.0 | 27.3 | 37.7 | 34.3 | 34.8 | 34.0 | ||
| Previous 30 years | 27.1 | 33.8 | 36.5 | 41.3 | 35.0 | 33.5 | 36.1 | 34.5 | 32.0 | 37.8 | 35.8 | 23.3 | 27.6 | 38.1 | 34.7 | 35.1 | 34.4 | ||
| Previous 20 years | 29.4 | 37.0 | 37.0 | 42.5 | 35.7 | 33.2 | 36.0 | 35.3 | 32.0 | 38.2 | 38.4 | 24.2 | 29.3 | 39.1 | 34.8 | 35.8 | 35.3 | ||
| 10 year groups | |||||||||||||||||||
| [2007,2017) | 34.1 | 39.9 | 40.6 | 45.0 | 39.8 | 37.7 | 37.6 | 37.7 | 34.5 | 39.9 | 40.6 | 25.6 | 32.0 | 42.5 | 37.7 | 38.0 | 38.2 | ||
| [1997,2007) | 21.3 | 30.5 | 29.9 | 33.8 | 27.3 | 24.6 | 30.6 | 28.8 | 26.8 | 33.8 | 32.9 | 21.4 | 23.8 | 30.5 | 27.5 | 30.6 | 28.4 | ||
| [1987,1997) | 19.2 | 24.1 | 34.0 | 34.3 | 32.7 | 35.2 | 36.3 | 30.9 | 32.0 | 35.9 | 26.1 | 18.6 | 20.8 | 33.6 | 34.2 | 31.5 | 30.2 | ||
| 5 year groups | |||||||||||||||||||
| [2012,2017) | 37.0 | 42.8 | 43.6 | 45.1 | 41.3 | 40.4 | 37.8 | 39.0 | 37.0 | 42.3 | 41.8 | 27.9 | 35.2 | 43.7 | 38.9 | 40.1 | 39.9 | ||
| [2007,2012) | 25.8 | 29.6 | 33.7 | 44.8 | 35.8 | 31.8 | 37.2 | 32.5 | 27.6 | 34.3 | 37.2 | 21.3 | 24.2 | 40.1 | 33.9 | 32.5 | 33.9 | ||
| [2002,2007) | 22.7 | 31.7 | 30.7 | 34.9 | 27.7 | 24.7 | 28.9 | 30.3 | 26.0 | 33.4 | 34.8 | 19.6 | 23.6 | 31.4 | 27.3 | 30.5 | 28.5 | ||
| [1997,2002) | 19.1 | 29.2 | 28.9 | 32.3 | 26.8 | 24.3 | 32.4 | 27.4 | 27.8 | 34.3 | 30.7 | 24.0 | 24.1 | 29.3 | 27.6 | 30.8 | 28.2 | ||
| [1992,1997) | 10.5 | 15.0 | 12.0 | 17.4 | 15.2 | 14.4 | 18.2 | 14.3 | 14.8 | 19.2 | 16.0 | 8.3 | 11.4 | 15.2 | 15.8 | 16.7 | 14.8 | ||
| [1987,1992) | 23.2 | 29.1 | 44.4 | 43.6 | 41.0 | 44.2 | 46.3 | 37.3 | 42.2 | 45.4 | 31.3 | 24.4 | 25.7 | 42.9 | 42.6 | 39.8 | 38.1 | ||
| Year | |||||||||||||||||||
| 2017 | 37.4 | 40.1 | 39.7 | 38.2 | 36.3 | 35.1 | 36.1 | 28.0 | 25.0 | 31.0 | 32.5 | 29.7 | 34.9 | 38.1 | 33.1 | 29.3 | 33.8 | ||
| 2016 | 38.0 | 40.8 | 44.6 | 45.4 | 48.9 | 40.9 | 37.8 | 38.0 | 38.6 | 42.5 | 41.9 | 33.2 | 37.4 | 46.0 | 38.7 | 40.9 | 41.0 | ||
| 2015 | 39.9 | 53.0 | 51.8 | 45.9 | 36.7 | 40.9 | 37.8 | 48.5 | 40.3 | 45.8 | 47.9 | 29.9 | 38.9 | 45.1 | 42.0 | 44.3 | 42.9 | ||
| 2014 | 44.2 | 47.1 | 42.6 | 51.3 | 38.9 | 39.9 | 35.9 | 30.4 | 37.0 | 39.1 | 42.6 | 30.3 | 38.3 | 46.1 | 35.1 | 39.0 | 39.7 | ||
| 2013 | 26.4 | 30.8 | 32.5 | 38.6 | 36.9 | 37.6 | 42.7 | 37.5 | 34.3 | 50.5 | 38.5 | 19.5 | 25.1 | 36.4 | 39.4 | 41.1 | 36.8 | ||
| 2012 | 34.0 | 37.8 | 39.4 | 43.9 | 39.6 | 43.1 | 35.3 | 31.2 | 27.7 | 28.1 | 26.2 | 16.0 | 28.0 | 41.7 | 37.2 | 27.5 | 35.0 | ||
| 2011 | 38.2 | 29.6 | 38.8 | 44.6 | 35.2 | 35.7 | 49.7 | 43.4 | 27.2 | 34.8 | 38.2 | 25.3 | 28.9 | 41.3 | 42.9 | 33.2 | 37.3 | ||
| 2010 | 21.9 | 27.2 | 31.8 | 45.5 | 32.1 | 27.6 | 37.2 | 31.8 | 38.2 | 42.1 | 52.9 | 26.7 | 25.8 | 38.7 | 31.7 | 42.3 | 35.6 | ||
| 2009 | 32.4 | 41.7 | 37.6 | 44.9 | 40.6 | 36.5 | 35.3 | 25.8 | 19.5 | 27.5 | 22.9 | 10.4 | 23.6 | 42.1 | 33.3 | 23.6 | 32.9 | ||
| 2008 | 16.6 | 29.6 | 28.5 | 43.5 | 31.5 | 23.9 | 34.9 | 26.9 | 26.9 | 41.9 | 40.5 | 31.8 | 26.6 | 37.7 | 27.6 | 37.2 | 33.7 | ||
| 2007 | 17.6 | 21.3 | 32.0 | 45.9 | 38.5 | 34.2 | 22.8 | 24.3 | 24.7 | 22.2 | 34.1 | 12.7 | 15.4 | 40.6 | 28.2 | 25.7 | 29.1 | ||
| 2006 | 25.0 | 34.0 | 28.2 | 39.6 | 27.4 | 18.4 | 31.5 | 28.9 | 26.4 | 30.6 | 31.2 | 18.8 | 23.6 | 33.7 | 26.0 | 28.6 | 28.7 | ||
| 2005 | 25.0 | 24.3 | 24.5 | 25.4 | 33.8 | 27.9 | 29.1 | 29.3 | 26.0 | 33.9 | 37.3 | 23.7 | 24.2 | 27.1 | 28.5 | 32.0 | 28.1 | ||
| 2004 | 25.8 | 29.6 | 31.2 | 33.7 | 24.4 | 18.0 | 27.9 | 20.2 | 22.3 | 31.3 | 32.0 | 14.7 | 23.6 | 29.9 | 21.8 | 27.8 | 25.8 | ||
| 2003 | 17.1 | 31.7 | 31.8 | 34.2 | 23.9 | 21.2 | 27.4 | 45.1 | 26.9 | 41.0 | 34.1 | 21.7 | 23.7 | 29.8 | 30.6 | 33.9 | 29.9 | ||
| 2002 | 18.3 | 39.0 | 39.8 | 35.6 | 30.5 | 32.4 | 28.3 | 21.1 | 27.7 | 28.6 | 38.8 | 17.2 | 23.0 | 35.3 | 28.8 | 30.0 | 29.7 | ||
| 2001 | 17.8 | 33.1 | 32.6 | 40.8 | 36.4 | 30.4 | 33.0 | 29.4 | 27.4 | 42.9 | 23.7 | 21.7 | 23.4 | 36.1 | 30.9 | 31.0 | 30.7 | ||
| 2000 | 29.4 | 41.8 | 43.3 | 41.0 | 37.5 | 26.1 | 35.5 | 30.0 | 29.0 | 38.9 | 26.4 | 28.0 | 32.9 | 40.6 | 30.2 | 32.4 | 34.0 | ||
| 1999 | 26.5 | 21.6 | 24.7 | 27.7 | 31.2 | 31.9 | 34.3 | 35.0 | 35.7 | 32.0 | 40.9 | 31.8 | 28.4 | 27.7 | 33.6 | 36.0 | 31.8 | ||
| 1998 | 16.2 | 15.1 | 19.5 | 13.0 | 6.2 | 6.6 | 23.5 | 7.5 | 12.9 | 12.8 | 48.1 | 16.0 | 15.8 | 13.1 | 11.9 | 18.9 | 14.3 | ||
| 1997 | 5.7 | 10.3 | 6.4 | 13.2 | 6.8 | 9.6 | 21.6 | 10.5 | 22.5 | 20.2 | 17.8 | 5.6 | 6.9 | 8.3 | 12.7 | 20.1 | 11.4 | ||
| 1996 | 9.0 | 12.8 | 5.3 | 14.0 | 9.3 | 11.1 | 12.6 | 8.2 | 6.9 | 18.8 | 13.8 | 3.4 | 8.5 | 10.1 | 10.8 | 12.1 | 10.3 | ||
| 1995 | 9.7 | 7.8 | 6.8 | 11.6 | 12.7 | 9.2 | 16.8 | 11.1 | 11.2 | 15.3 | 14.3 | 10.6 | 9.2 | 10.6 | 12.9 | 13.7 | 11.5 | ||
| 1994 | 11.8 | 28.6 | 14.7 | 25.6 | 12.5 | 23.9 | 22.1 | 17.2 | 14.8 | 14.5 | 15.0 | 5.6 | 15.2 | 16.9 | 20.9 | 14.7 | 16.6 | ||
| 1993 | 10.2 | 16.7 | 9.7 | 20.0 | 28.8 | 21.7 | 24.5 | 25.0 | 23.5 | 23.3 | 13.0 | 11.6 | 13.3 | 19.7 | 23.6 | 19.7 | 18.7 | ||
| 1992 | 12.3 | 14.8 | 23.5 | 22.3 | 20.8 | 14.3 | 20.7 | 19.5 | 21.1 | 33.9 | 23.7 | 11.7 | 12.8 | 22.3 | 17.9 | 25.7 | 20.2 | ||
| 1991 | 13.4 | 7.4 | 19.8 | 18.4 | 15.5 | 13.5 | 28.6 | 22.0 | 17.5 | 32.2 | 23.0 | 20.0 | 12.5 | 17.8 | 20.6 | 24.0 | 18.0 | ||
| 1990 | 15.5 | 19.5 | 31.2 | 24.5 | 27.1 | 31.9 | 36.1 | 25.4 | 26.1 | 21.4 | 24.7 | 21.1 | 18.3 | 27.5 | 31.2 | 24.1 | 24.2 | ||
| 1989 | 25.0 | 36.2 | 50.7 | 49.6 | 42.9 | 45.7 | 45.2 | 40.7 | 41.7 | 45.1 | 27.6 | 26.2 | 29.7 | 48.0 | 44.0 | 38.9 | 40.5 | ||
| 1988 | 31.0 | 36.6 | 47.8 | 50.4 | 45.0 | 52.3 | 50.3 | 44.6 | 54.0 | 53.5 | 28.8 | 20.8 | 30.1 | 47.6 | 49.2 | 45.3 | 42.7 | ||
| 1987 | 45.5 | 40.0 | 49.8 | 48.0 | 48.4 | 50.2 | 52.3 | 35.8 | 45.5 | 51.0 | 40.2 | 28.9 | 30.4 | 48.7 | 45.5 | 45.7 | 45.2 | ||
| 1986 | 15.4 | 23.7 | 18.9 | 27.8 | 14.9 | 11.8 | 8.7 | 19.4 | 12.9 | 15.7 | 27.6 | 14.3 | 18.2 | 19.9 | 14.0 | 18.0 | 17.8 | ||
| 1985 | 3.3 | 20.0 | 7.7 | 10.5 | 8.8 | 11.7 | 12.5 | 29.4 | 18.2 | 10.5 | 20.0 | 7.1 | 10.2 | 9.2 | 15.3 | 15.0 | 11.3 | ||
| 1984 | 0.0 | 0.0 | 0.0 | 0.0 | 0.0 | 0.0 | 0.0 | 6.1 | 7.4 | 5.9 | 12.9 | 8.8 | 6.1 | 0.0 | 2.7 | 8.7 | 5.5 | ||
| 1983 | 0.0 | 0.0 | 0.0 | 15.4 | 33.3 | 7.7 | 0.0 | 9.1 | 0.0 | - | 0.0 | 0.0 | 0.0 | 18.5 | 6.7 | 0.0 | 7.0 | ||
| 1982 | - | 0.0 | - | 0.0 | 0.0 | 0.0 | - | 0.0 | - | 0.0 | - | 0.0 | 0.0 | 0.0 | 0.0 | 0.0 | 0.0 | ||
Breeding data
Breeding records by month
Number of breeding records by breeding code and month, 2017 and all years| Breeding code | Jul | Aug | Sep | Oct | Nov | Dec | Jan | Feb | Mar | Apr | May | Jun |
|---|---|---|---|---|---|---|---|---|---|---|---|---|
| 2017 | ||||||||||||
| Breeding (BLA code) | 0 | 0 | 0 | 0 | 0 | 0 | 0 | 0 | 0 | 0 | 0 | 0 |
| Carrying Food | 0 | 0 | 0 | 0 | 2 | 0 | 1 | 0 | 0 | 0 | 0 | 0 |
| Copulating | 0 | 0 | 0 | 0 | 0 | 0 | 0 | 0 | 0 | 0 | 0 | 0 |
| Display | 0 | 0 | 0 | 0 | 1 | 0 | 0 | 0 | 0 | 0 | 0 | 0 |
| Dependent young | 0 | 0 | 5 | 29 | 17 | 3 | 34 | 12 | 0 | 0 | 0 | 0 |
| Faecal sac | 0 | 0 | 1 | 0 | 0 | 0 | 0 | 0 | 0 | 0 | 0 | 0 |
| Inspecting hollow | 0 | 0 | 0 | 0 | 0 | 0 | 0 | 0 | 0 | 0 | 0 | 0 |
| Nest building | 0 | 1 | 0 | 0 | 1 | 2 | 1 | 0 | 0 | 0 | 0 | 0 |
| Nest with eggs | 0 | 0 | 0 | 2 | 0 | 0 | 0 | 0 | 0 | 0 | 0 | 0 |
| Nest with young | 0 | 0 | 1 | 5 | 1 | 1 | 1 | 0 | 0 | 0 | 0 | 0 |
| On/leaving nest | 0 | 0 | 2 | 3 | 2 | 2 | 0 | 0 | 0 | 0 | 0 | 0 |
| All years | ||||||||||||
| Breeding (BLA code) | 0 | 2 | 13 | 35 | 7 | 26 | 12 | 2 | 3 | 0 | 0 | 0 |
| Carrying Food | 0 | 0 | 1 | 6 | 4 | 3 | 3 | 0 | 0 | 0 | 0 | 0 |
| Copulating | 0 | 0 | 0 | 0 | 0 | 0 | 0 | 0 | 0 | 0 | 0 | 0 |
| Display | 0 | 0 | 1 | 0 | 1 | 0 | 0 | 0 | 0 | 0 | 0 | 0 |
| Dependent young | 0 | 1 | 20 | 211 | 98 | 84 | 112 | 63 | 14 | 2 | 1 | 1 |
| Faecal sac | 0 | 0 | 1 | 0 | 0 | 0 | 0 | 0 | 0 | 0 | 0 | 0 |
| Inspecting hollow | 0 | 0 | 0 | 0 | 0 | 0 | 0 | 0 | 0 | 0 | 0 | 0 |
| Nest building | 2 | 16 | 16 | 26 | 11 | 7 | 4 | 1 | 1 | 0 | 0 | 0 |
| Nest with eggs | 0 | 2 | 2 | 3 | 2 | 2 | 1 | 0 | 0 | 0 | 0 | 0 |
| Nest with young | 1 | 1 | 14 | 41 | 22 | 11 | 4 | 1 | 0 | 0 | 0 | 1 |
| On/leaving nest | 0 | 3 | 9 | 30 | 10 | 5 | 1 | 0 | 0 | 0 | 0 | 0 |
Breeding records by year
Average number of breeding records per period by breeding code| Period | Breeding (BLA code) | Carrying Food | Copulating | Display | Dependent young | Faecal sac | Inspecting hollow | Nest building | Nest with eggs | Nest with young | On/leaving nest |
|---|---|---|---|---|---|---|---|---|---|---|---|
| All years | |||||||||||
| All | 2.8 | 0.5 | 0.0 | 0.1 | 16.9 | 0.0 | 0.0 | 2.3 | 0.3 | 2.7 | 1.6 |
| Previous years | |||||||||||
| All previous years | 2.9 | 0.4 | 0.0 | 0.0 | 14.5 | 0.0 | 0.0 | 2.3 | 0.3 | 2.5 | 1.4 |
| Previous 30 years | 3.3 | 0.5 | 0.0 | 0.0 | 16.9 | 0.0 | 0.0 | 2.6 | 0.3 | 2.9 | 1.6 |
| Previous 20 years | 5.0 | 0.6 | 0.0 | 0.0 | 18.6 | 0.0 | 0.0 | 2.2 | 0.0 | 3.0 | 2.2 |
| 10 year groups | |||||||||||
| [2007,2017) | 2.9 | 0.6 | 0.0 | 0.1 | 27.8 | 0.0 | 0.0 | 3.5 | 0.1 | 4.7 | 4.0 |
| [1997,2007) | 7.1 | 0.5 | 0.0 | 0.0 | 9.5 | 0.0 | 0.0 | 0.9 | 0.0 | 1.4 | 0.5 |
| [1987,1997) | 0.0 | 0.3 | 0.0 | 0.0 | 13.4 | 0.0 | 0.0 | 3.5 | 0.9 | 2.6 | 0.4 |
| 5 year groups | |||||||||||
| [2012,2017) | 1.8 | 1.0 | 0.0 | 0.2 | 38.0 | 0.0 | 0.0 | 5.0 | 0.0 | 6.6 | 5.6 |
| [2007,2012) | 4.0 | 0.2 | 0.0 | 0.0 | 17.6 | 0.0 | 0.0 | 2.0 | 0.2 | 2.8 | 2.4 |
| [2002,2007) | 4.8 | 0.6 | 0.0 | 0.0 | 12.2 | 0.0 | 0.0 | 1.0 | 0.0 | 1.6 | 0.6 |
| [1997,2002) | 9.4 | 0.4 | 0.0 | 0.0 | 6.8 | 0.0 | 0.0 | 0.8 | 0.0 | 1.2 | 0.4 |
| [1992,1997) | 0.0 | 0.0 | 0.0 | 0.0 | 2.6 | 0.0 | 0.0 | 0.6 | 0.0 | 1.2 | 0.4 |
| [1987,1992) | 0.0 | 0.6 | 0.0 | 0.0 | 24.2 | 0.0 | 0.0 | 6.4 | 1.8 | 4.0 | 0.4 |
| Year | |||||||||||
| 2017 | 0.0 | 3.0 | 0.0 | 1.0 | 100.0 | 1.0 | 0.0 | 5.0 | 2.0 | 9.0 | 9.0 |
| 2016 | 0.0 | 0.0 | 0.0 | 0.0 | 64.0 | 0.0 | 0.0 | 5.0 | 0.0 | 14.0 | 8.0 |
| 2015 | 0.0 | 1.0 | 0.0 | 1.0 | 54.0 | 0.0 | 0.0 | 14.0 | 0.0 | 9.0 | 10.0 |
| 2014 | 2.0 | 3.0 | 0.0 | 0.0 | 41.0 | 0.0 | 0.0 | 2.0 | 0.0 | 2.0 | 3.0 |
| 2013 | 3.0 | 1.0 | 0.0 | 0.0 | 16.0 | 0.0 | 0.0 | 2.0 | 0.0 | 2.0 | 1.0 |
| 2012 | 4.0 | 0.0 | 0.0 | 0.0 | 15.0 | 0.0 | 0.0 | 2.0 | 0.0 | 6.0 | 6.0 |
| 2011 | 3.0 | 0.0 | 0.0 | 0.0 | 20.0 | 0.0 | 0.0 | 3.0 | 0.0 | 1.0 | 2.0 |
| 2010 | 2.0 | 0.0 | 0.0 | 0.0 | 15.0 | 0.0 | 0.0 | 1.0 | 1.0 | 3.0 | 0.0 |
| 2009 | 9.0 | 1.0 | 0.0 | 0.0 | 26.0 | 0.0 | 0.0 | 3.0 | 0.0 | 7.0 | 0.0 |
| 2008 | 1.0 | 0.0 | 0.0 | 0.0 | 15.0 | 0.0 | 0.0 | 3.0 | 0.0 | 2.0 | 6.0 |
| 2007 | 5.0 | 0.0 | 0.0 | 0.0 | 12.0 | 0.0 | 0.0 | 0.0 | 0.0 | 1.0 | 4.0 |
| 2006 | 0.0 | 2.0 | 0.0 | 0.0 | 21.0 | 0.0 | 0.0 | 1.0 | 0.0 | 4.0 | 1.0 |
| 2005 | 0.0 | 1.0 | 0.0 | 0.0 | 13.0 | 0.0 | 0.0 | 1.0 | 0.0 | 4.0 | 1.0 |
| 2004 | 1.0 | 0.0 | 0.0 | 0.0 | 3.0 | 0.0 | 0.0 | 1.0 | 0.0 | 0.0 | 1.0 |
| 2003 | 1.0 | 0.0 | 0.0 | 0.0 | 17.0 | 0.0 | 0.0 | 0.0 | 0.0 | 0.0 | 0.0 |
| 2002 | 22.0 | 0.0 | 0.0 | 0.0 | 7.0 | 0.0 | 0.0 | 2.0 | 0.0 | 0.0 | 0.0 |
| 2001 | 23.0 | 0.0 | 0.0 | 0.0 | 4.0 | 0.0 | 0.0 | 0.0 | 0.0 | 1.0 | 0.0 |
| 2000 | 20.0 | 0.0 | 0.0 | 0.0 | 15.0 | 0.0 | 0.0 | 3.0 | 0.0 | 2.0 | 1.0 |
| 1999 | 4.0 | 2.0 | 0.0 | 0.0 | 12.0 | 0.0 | 0.0 | 0.0 | 0.0 | 0.0 | 1.0 |
| 1998 | 0.0 | 0.0 | 0.0 | 0.0 | 2.0 | 0.0 | 0.0 | 0.0 | 0.0 | 2.0 | 0.0 |
| 1997 | 0.0 | 0.0 | 0.0 | 0.0 | 1.0 | 0.0 | 0.0 | 1.0 | 0.0 | 1.0 | 0.0 |
| 1996 | 0.0 | 0.0 | 0.0 | 0.0 | 2.0 | 0.0 | 0.0 | 0.0 | 0.0 | 1.0 | 0.0 |
| 1995 | 0.0 | 0.0 | 0.0 | 0.0 | 2.0 | 0.0 | 0.0 | 1.0 | 0.0 | 0.0 | 0.0 |
| 1994 | 0.0 | 0.0 | 0.0 | 0.0 | 5.0 | 0.0 | 0.0 | 0.0 | 0.0 | 2.0 | 1.0 |
| 1993 | 0.0 | 0.0 | 0.0 | 0.0 | 2.0 | 0.0 | 0.0 | 1.0 | 0.0 | 2.0 | 0.0 |
| 1992 | 0.0 | 0.0 | 0.0 | 0.0 | 2.0 | 0.0 | 0.0 | 1.0 | 0.0 | 1.0 | 1.0 |
| 1991 | 0.0 | 0.0 | 0.0 | 0.0 | 9.0 | 0.0 | 0.0 | 1.0 | 1.0 | 0.0 | 1.0 |
| 1990 | 0.0 | 1.0 | 0.0 | 0.0 | 14.0 | 0.0 | 0.0 | 0.0 | 1.0 | 1.0 | 0.0 |
| 1989 | 0.0 | 0.0 | 0.0 | 0.0 | 34.0 | 0.0 | 0.0 | 16.0 | 2.0 | 5.0 | 1.0 |
| 1988 | 0.0 | 0.0 | 0.0 | 0.0 | 37.0 | 0.0 | 0.0 | 6.0 | 3.0 | 6.0 | 0.0 |
| 1987 | 0.0 | 2.0 | 0.0 | 0.0 | 27.0 | 0.0 | 0.0 | 9.0 | 2.0 | 8.0 | 0.0 |
| 1986 | 0.0 | 0.0 | 0.0 | 0.0 | 0.0 | 0.0 | 0.0 | 0.0 | 0.0 | 0.0 | 0.0 |
| 1985 | 0.0 | 0.0 | 0.0 | 0.0 | 0.0 | 0.0 | 0.0 | 0.0 | 0.0 | 0.0 | 0.0 |
| 1984 | 0.0 | 0.0 | 0.0 | 0.0 | 0.0 | 0.0 | 0.0 | 0.0 | 0.0 | 0.0 | 0.0 |
| 1983 | 0.0 | 0.0 | 0.0 | 0.0 | 0.0 | 0.0 | 0.0 | 0.0 | 0.0 | 0.0 | 0.0 |
| 1982 | 0.0 | 0.0 | 0.0 | 0.0 | 0.0 | 0.0 | 0.0 | 0.0 | 0.0 | 0.0 | 0.0 |
Distribution map
Distribution - 2017
This map shows the observed distribution of the Red Wattlebird for 2017.
The red circles are the grid cells where Red Wattlebird have been reported.
The transparency of the red circles indicate how many surveys sheets were submitted for that grid cell; the darker the red the more reliable the data. Of the 315 grid cells with reports, 83 had only one sheet; an example is grid number A9.
The size of the circle represents the reporting rate. The maximum reporting rate for Red Wattlebird was 100.0% (eg grid number A9) and the minimum was 1.8% (eg grid number J18). 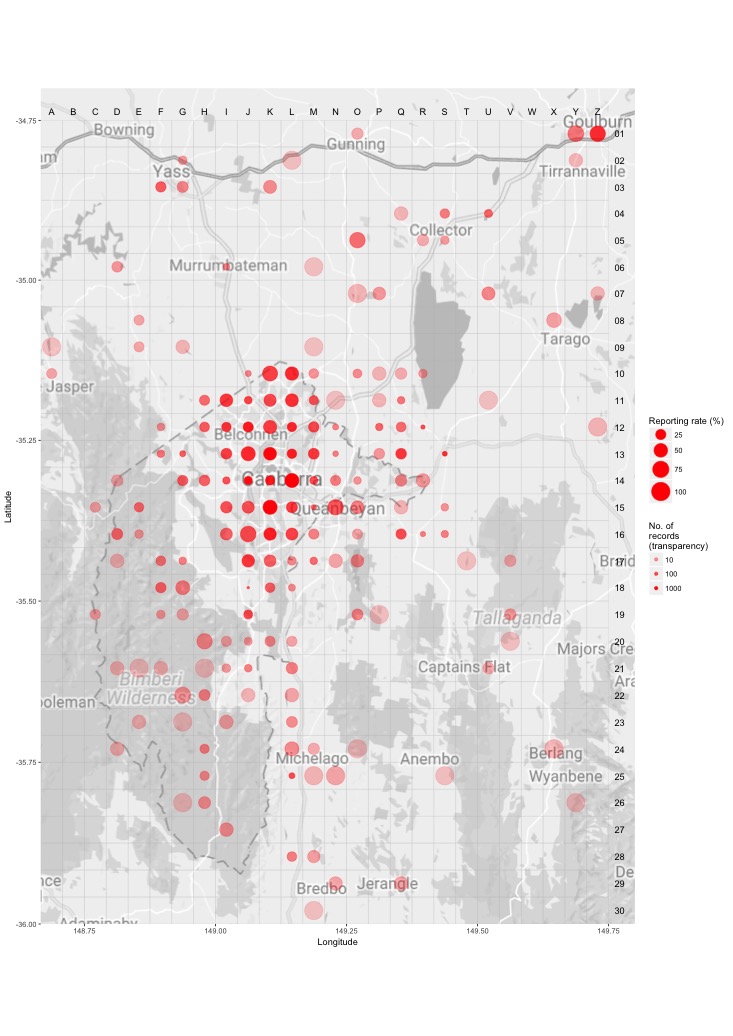
Distribution - all years
This map shows the observed distribution of the Red Wattlebird for all years.
The red circles are the grid cells where Red Wattlebird have been reported.
The transparency of the red circles indicate how many surveys sheets were submitted for that grid cell; the darker the red the more reliable the data. Of the 703 grid cells with reports, 55 had only one sheet; an example is grid number A12.
The size of the circle represents the reporting rate. The maximum reporting rate for Red Wattlebird was 100.0% (eg grid number A12) and the minimum was 0.3% (eg grid number Z8). 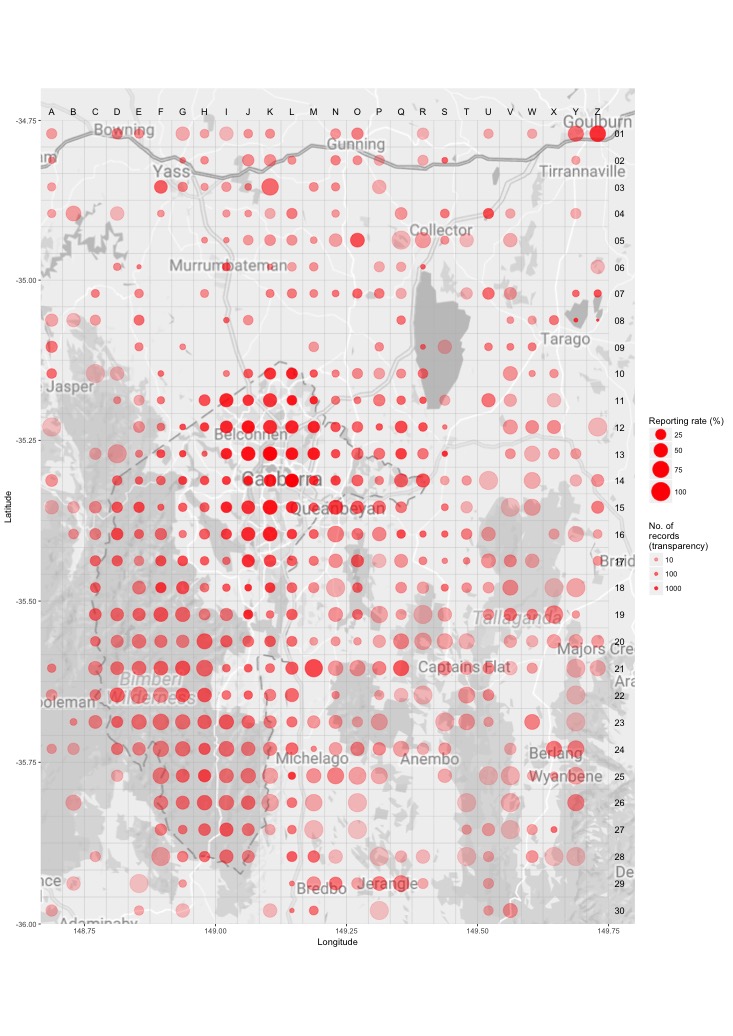
Breeding map
Breeding - 2017
This map shows the breeding distribution of the Red Wattlebird for 2017.
The red circles are the grid cells where breeding activity for Red Wattlebird have been reported.
The size of the circle represents the number of reports. 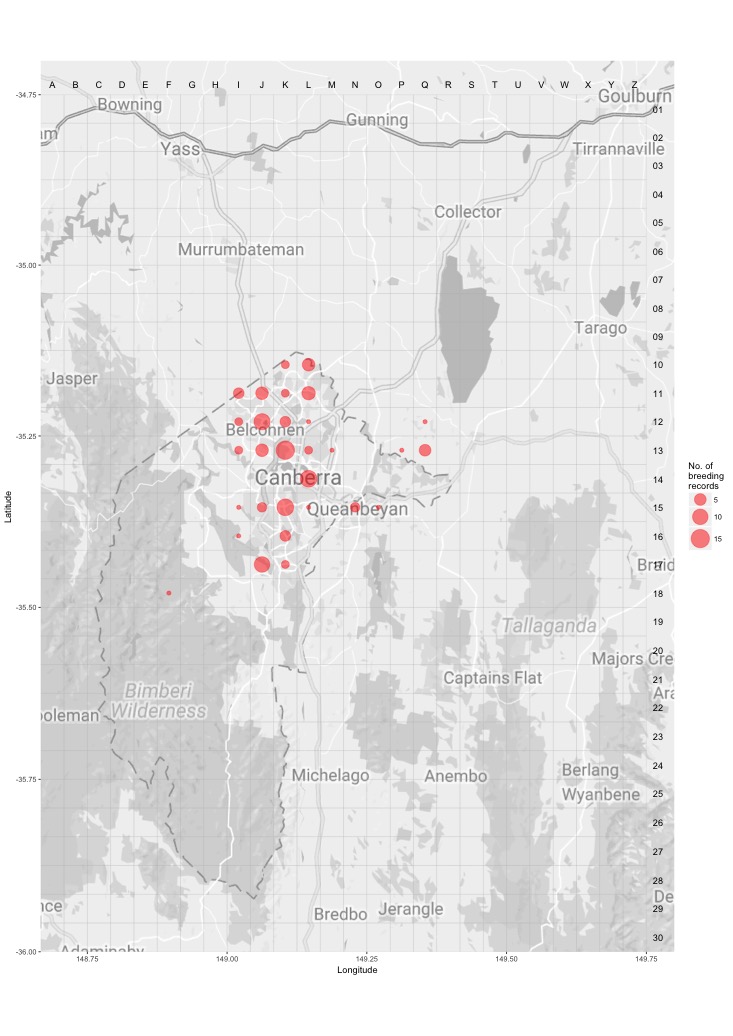
Breeding - all years
This map shows the breeding distribution of the Red Wattlebird for all years.
The red circles are the grid cells where breeding activity for Red Wattlebird have been reported.
The size of the circle represents the number of reports. 